
I have been having a lot of fun exploring choroplethr package created by Ari Lamstein and even made a census Shiny app.
Its time to put this skill in practice. Today I’m going to use R to understand demographics of the state of Maine, the city of Portland, and zipcode of 04101.
First, have a look the state data, head only.
library(choroplethr)
data(df_pop_state)
head(df_pop_state)
## region value
##1 alabama 4777326
##2 alaska 711139
##3 arizona 6410979
##4 arkansas 2916372
##5 california 37325068
##6 colorado 5042853So, what is the population of Maine?
df_pop_state[df_pop_state$region == 'maine', ]## region value
##20 maine 1329084Let’s make a boxplot to see the distribution of population in the US, and where is Maine’s position.
options("scipen"=100, "digits"=4)
summary(df_pop_state$value)
boxplot(df_pop_state$value)
## Min. 1st Qu. Median Mean 3rd Qu. Max.
## 563000 1700000 4340000 6060000 6650000 37300000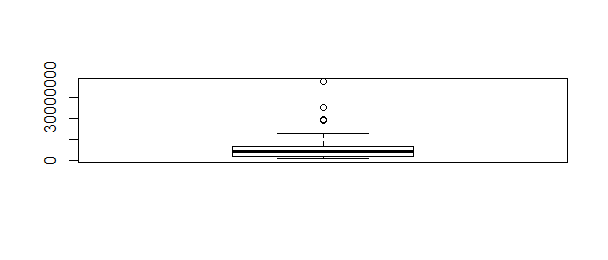
The median population of a state in the US is over 4.3 million, 3 times of Maine’s population. And Maine’s population is less than the first quartile value. This indicates that about 75% of states have a population more than Maine’s, or about 25% of states have a population less than Maine’s.
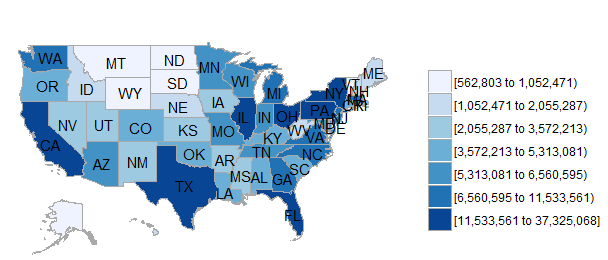
state_choropleth(df_pop_state)Here you go. Now We can see which states are the most/least populated.
I think I like this color and scale better.
state_choropleth(df_pop_state, num_colors = 1)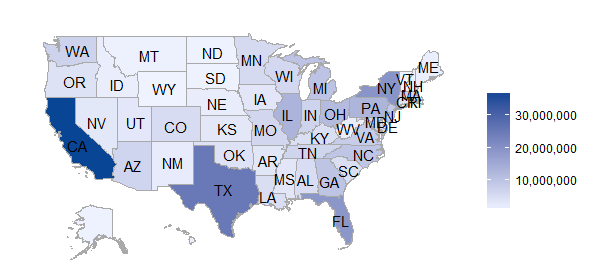
Let me drill down to some other interesting facts.
data(df_state_demographics)
names(df_state_demographics)
df_state_demographics$per_capita_income[df_state_demographics$region == 'maine']
## 26824The income per capita in Maine is $26824. and how is it to compare with the other states?
df_state_demographics$value = df_state_demographics$per_capita_income
state_choropleth(df_state_demographics, num_colors=5)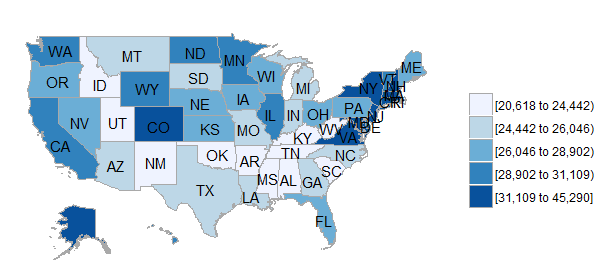
Not bad, almost in the middle.
How about the percentage of white population?
df_state_demographics$percent_white[df_state_demographics$region == 'maine']
df_state_demographics$value = df_state_demographics$percent_white
 state_choropleth(df_state_demographics, num_colors=5)
## 94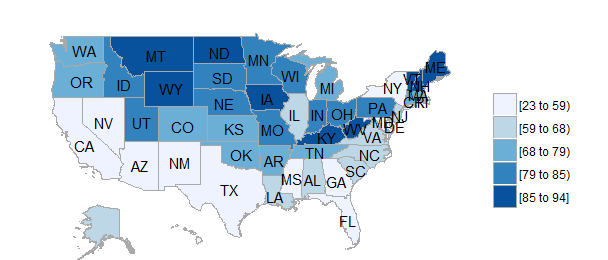
Seems Maine is among the whitest states in the nation (caucasian population at 94%). Wikipedia says that Maine has the highest percentage of French Americans among American states and most of the French in Maine are of Canadian Origin and they came from Quebec as immigrants between 1840 and 1930. Interesting.
Now, how about county, or city?
After a quick google search, I found Portland Maine belongs to Cumberland County, the FIPS code for Cumberland County is 23005.
So the population of Cumberland County is:
data(df_pop_county)
df_pop_county[df_pop_county$region == 23005, ]

boxplot(df_pop_county$value)
## region value
##1180 23005 282143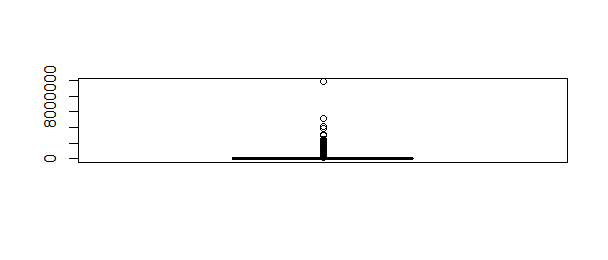
A little over 282,000.
It’s hard to compare all counties across the US, because there are so many outliers(counties with extreme large population).
county_choropleth(df_pop_county, num_colors=1)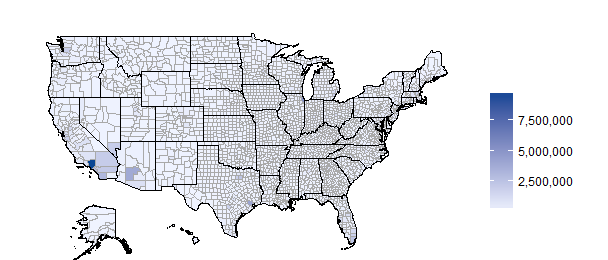
The national map does not tell us good story anymore, because there are so many counties. Let’s zoom in.
county_choropleth(df_pop_county, state_zoom="maine", num_colors=4)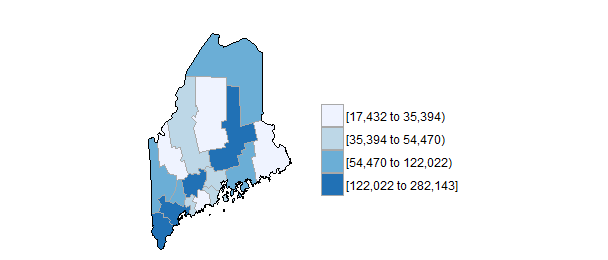
Apparently, Cumberland is the most populated county in Maine.
What is the median rent in Cumberland? And how is it to compare with other counties?
data("df_county_demographics")
df_county_demographics$median_rent[df_county_demographics$region == 23005]
## 847df_county_demographics$value = df_county_demographics$median_rent
county_choropleth(df_county_demographics, num_colors=1, state_zoom="maine")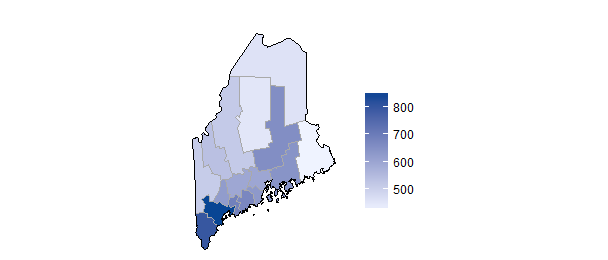
Oh no, Cumberland county has one of the highest median rent, people who live there must be well off!
Now let’s drill down even further to the zipcode.
What is the population of the zip code 04101?
library(choroplethrZip)
data(df_pop_zip)
df_pop_zip[df_pop_zip$region == "04101", ]
## region value
##1067 04101 17844zip_choropleth(df_pop_zip, state_zoom="maine")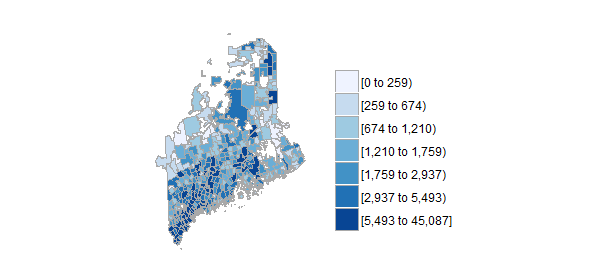
It turns out, zip 04101 area is among the most populated zip areas in Maine. However, the most popuated zip area in Maine has 45087 people.
Let’s zoom in to the county level for the zipcode.
zip_choropleth(df_pop_zip, county_zoom=23005)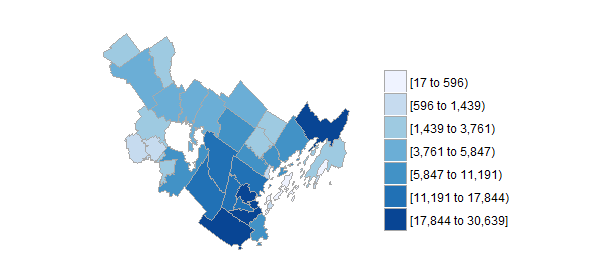
Still, zip 04101 area is one of the most populated zip areas in Cumberland county, and the most populated zip area in the county has 30639 people.
Let’s explore more details on the demographics of this zip area.
data(df_zip_demographics)
df_zip_demographics$per_capita_income[df_zip_demographics$region == "04101"]
## 24560The income per capita in this zip area is $24560. Let’s see what that means.
df_zip_demographics$value = df_zip_demographics$per_capita_income
zip_choropleth(df_zip_demographics, county_zoom=23005, num_colors=1)
Can anyone draw any inference from this map? It seems the highest income per capita in the county is a lot more than $60K, and lowest much below $20K.
According to above maps, I’m already jealous of people who live in Portland Maine.
The souce code used to create this blog can be found here.